Confused about hazard ratios , p-values in clinical trials? Let’s break it down step-by-step for you!
Do you feel overwhelmed by p-values, confidence intervals, or hazard ratios when reading medical literature? You're not alone, but it's easier than you think to understand these key concepts!

Journal Club Ep 06
What are Measures of Significance
Why they matter:
They help us evaluate if a study’s findings are meaningful or just due to chance
"Significance is about deciding whether the results reflect real-world effects or random noise."
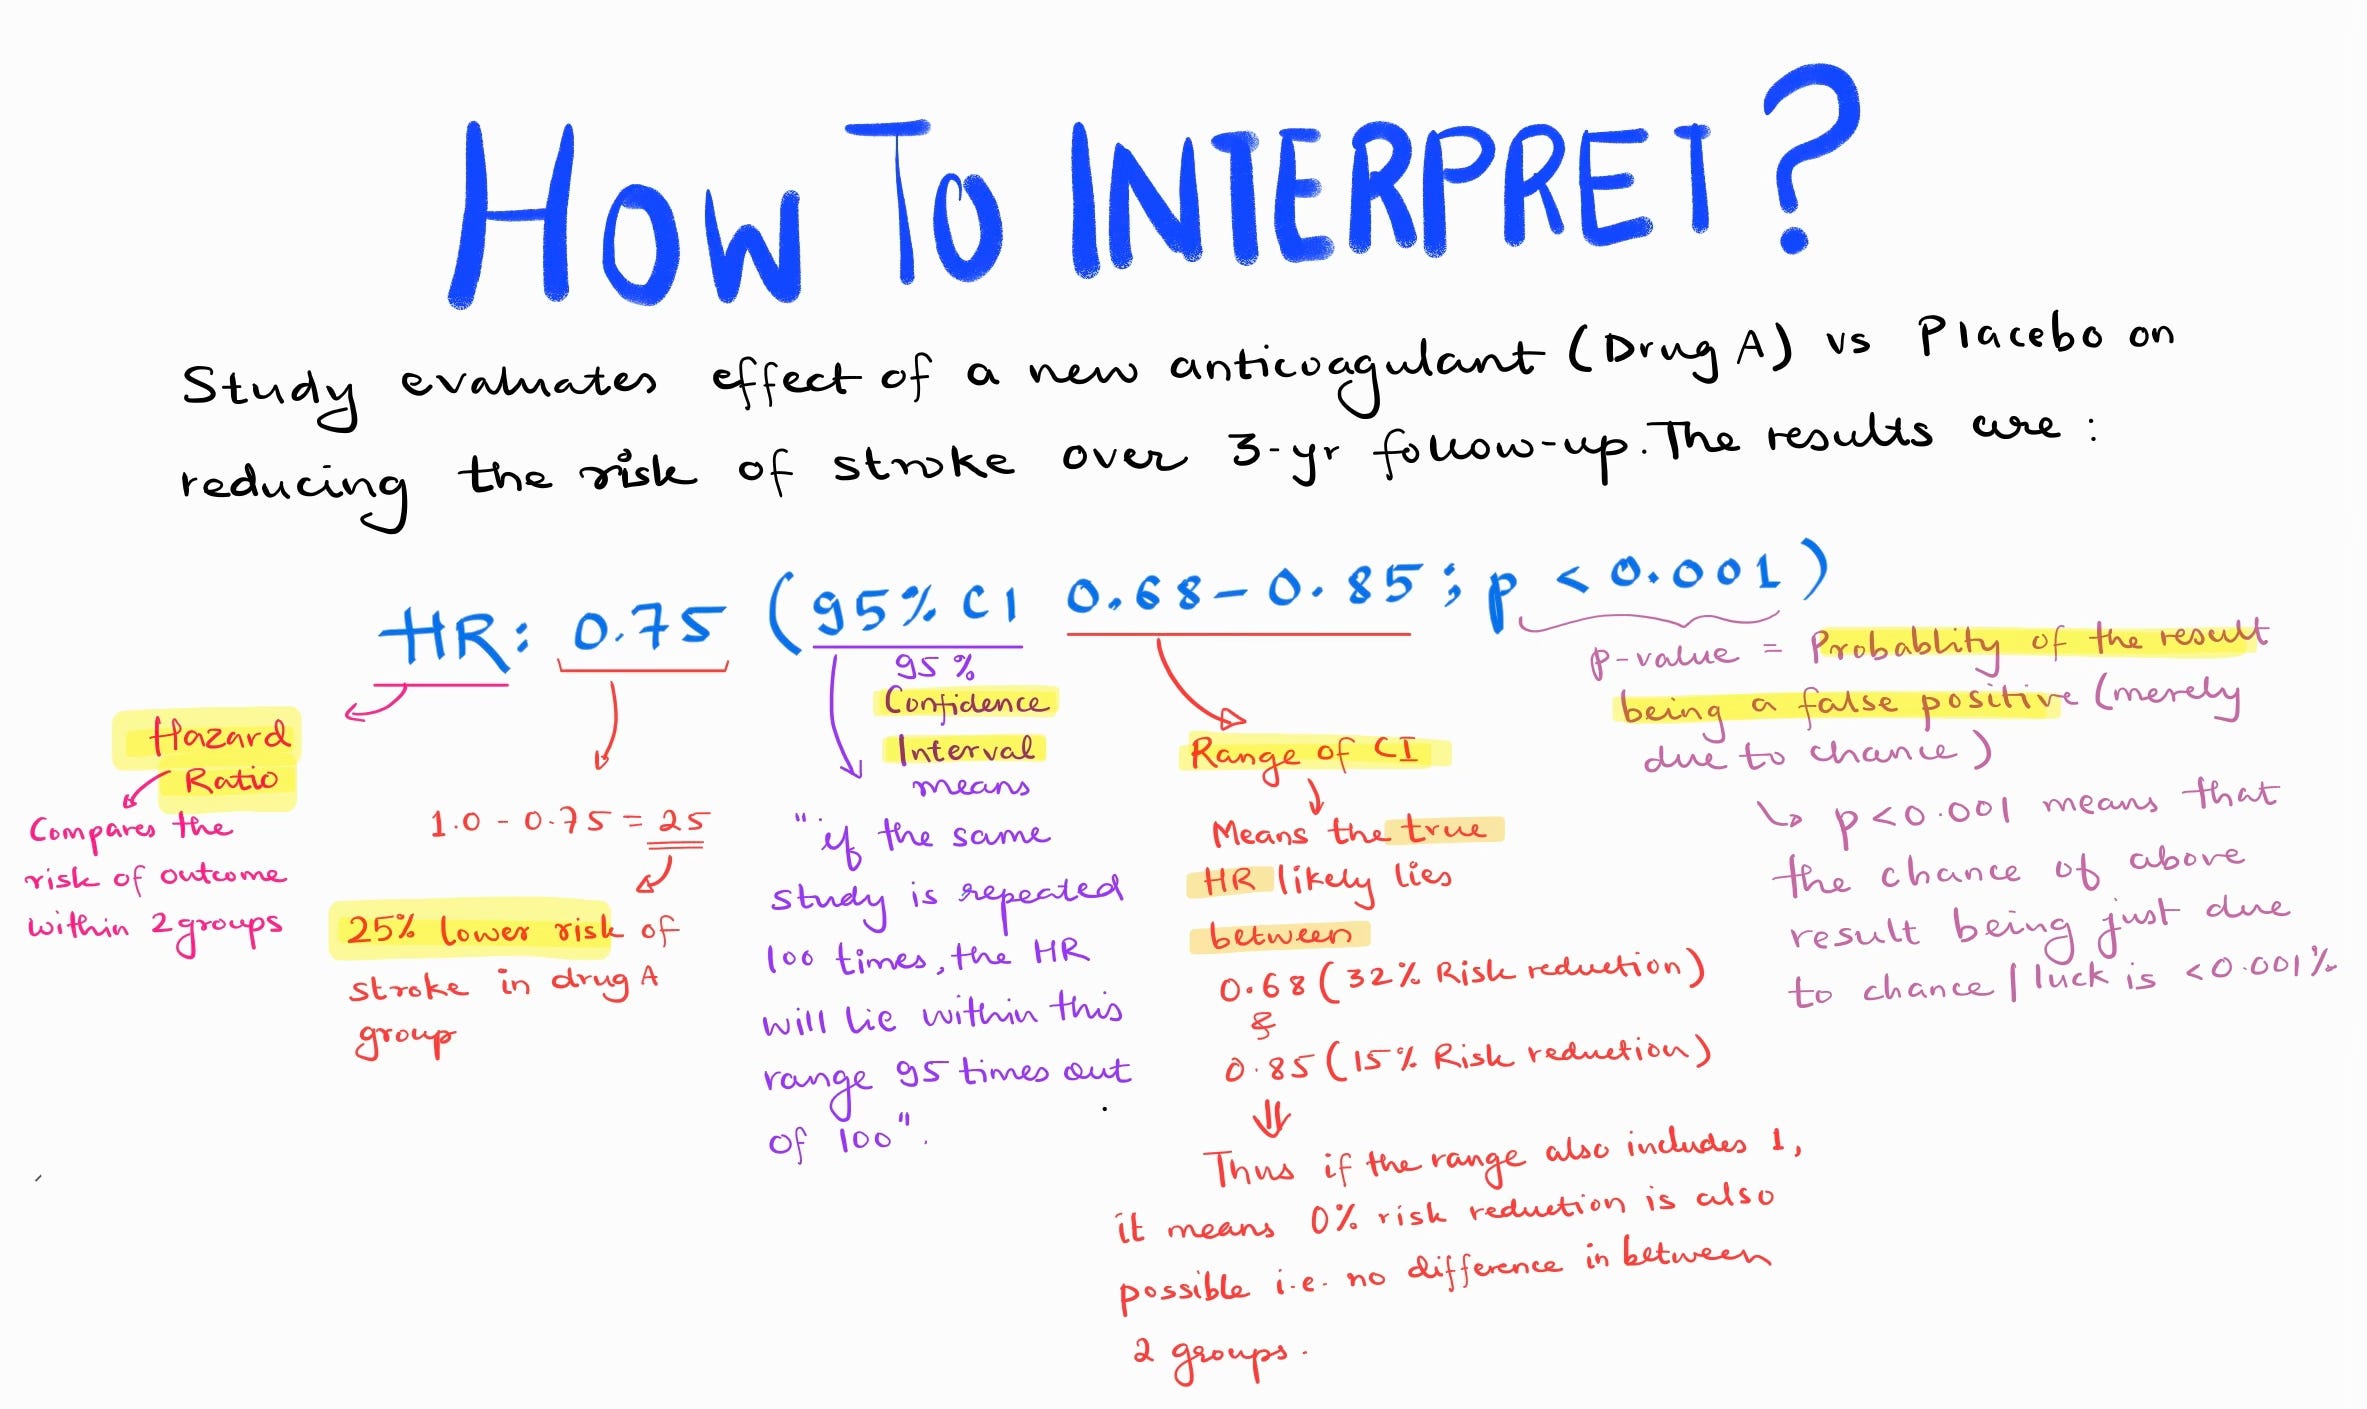
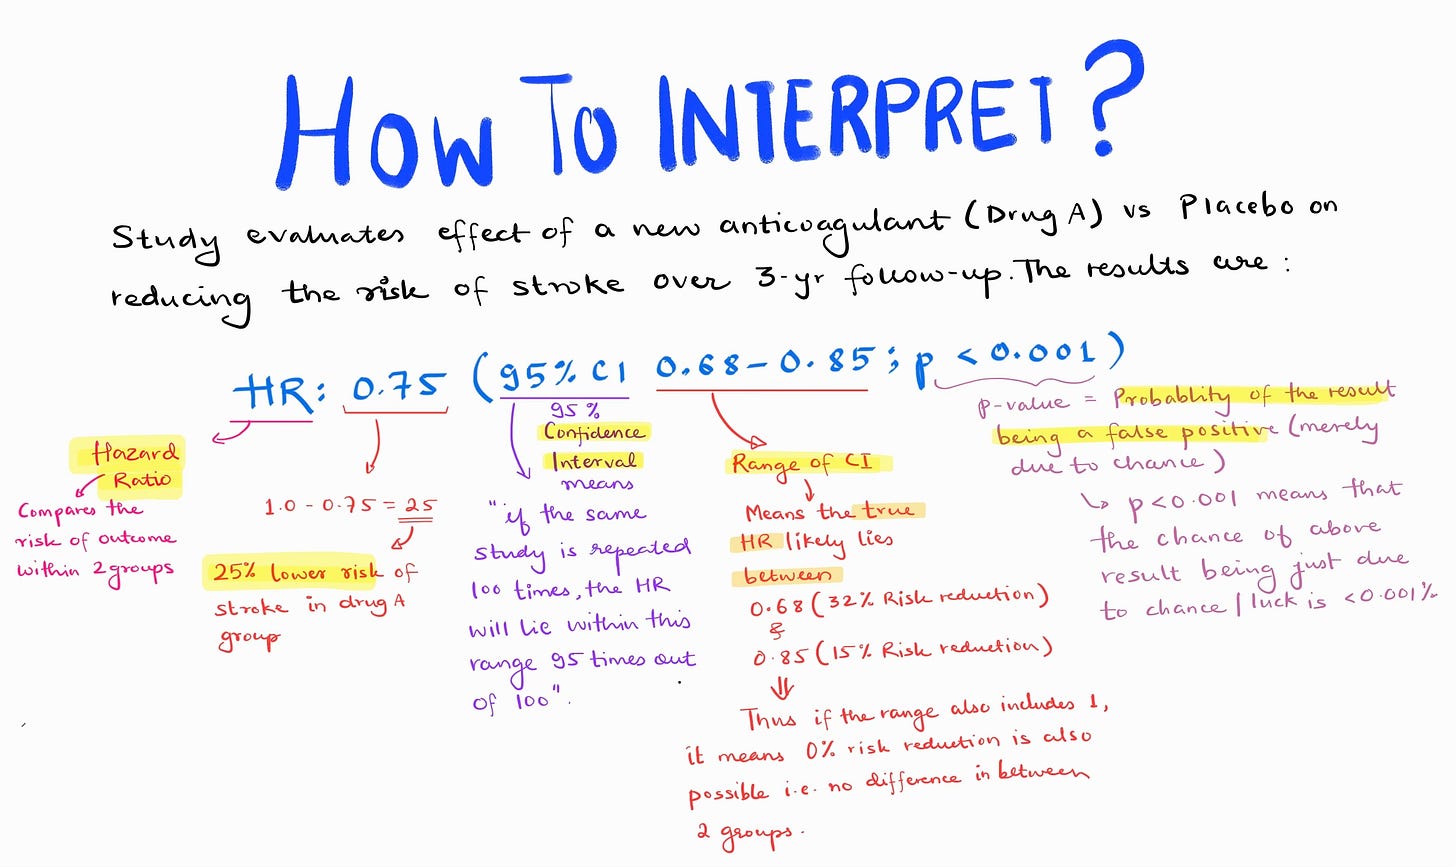
What is a P-Value, and Why is it Important?
Definition:
A p-value is the probability that the observed results occurred purely by chance
(that means the null hypothesis is true).
Importance:
Helps determine whether a result is statistically significant.
Benefits of P-Values:
Quick Assessment: Easily identifies statistical significance.
Widely Accepted: Universally used in research.
Useful for Hypothesis Testing: Rejects or fails to reject the null hypothesis.
Limitations of P-Values:
No Magnitude or Direction: Doesn't tell you the size or clinical relevance of the effect.
Arbitrary Threshold: A result with p = 0.051 may be ignored, while p = 0.049 is emphasized, despite negligible differences.
Influenced by Sample Size: Larger samples can make even small, clinically irrelevant effects statistically significant.
Example:
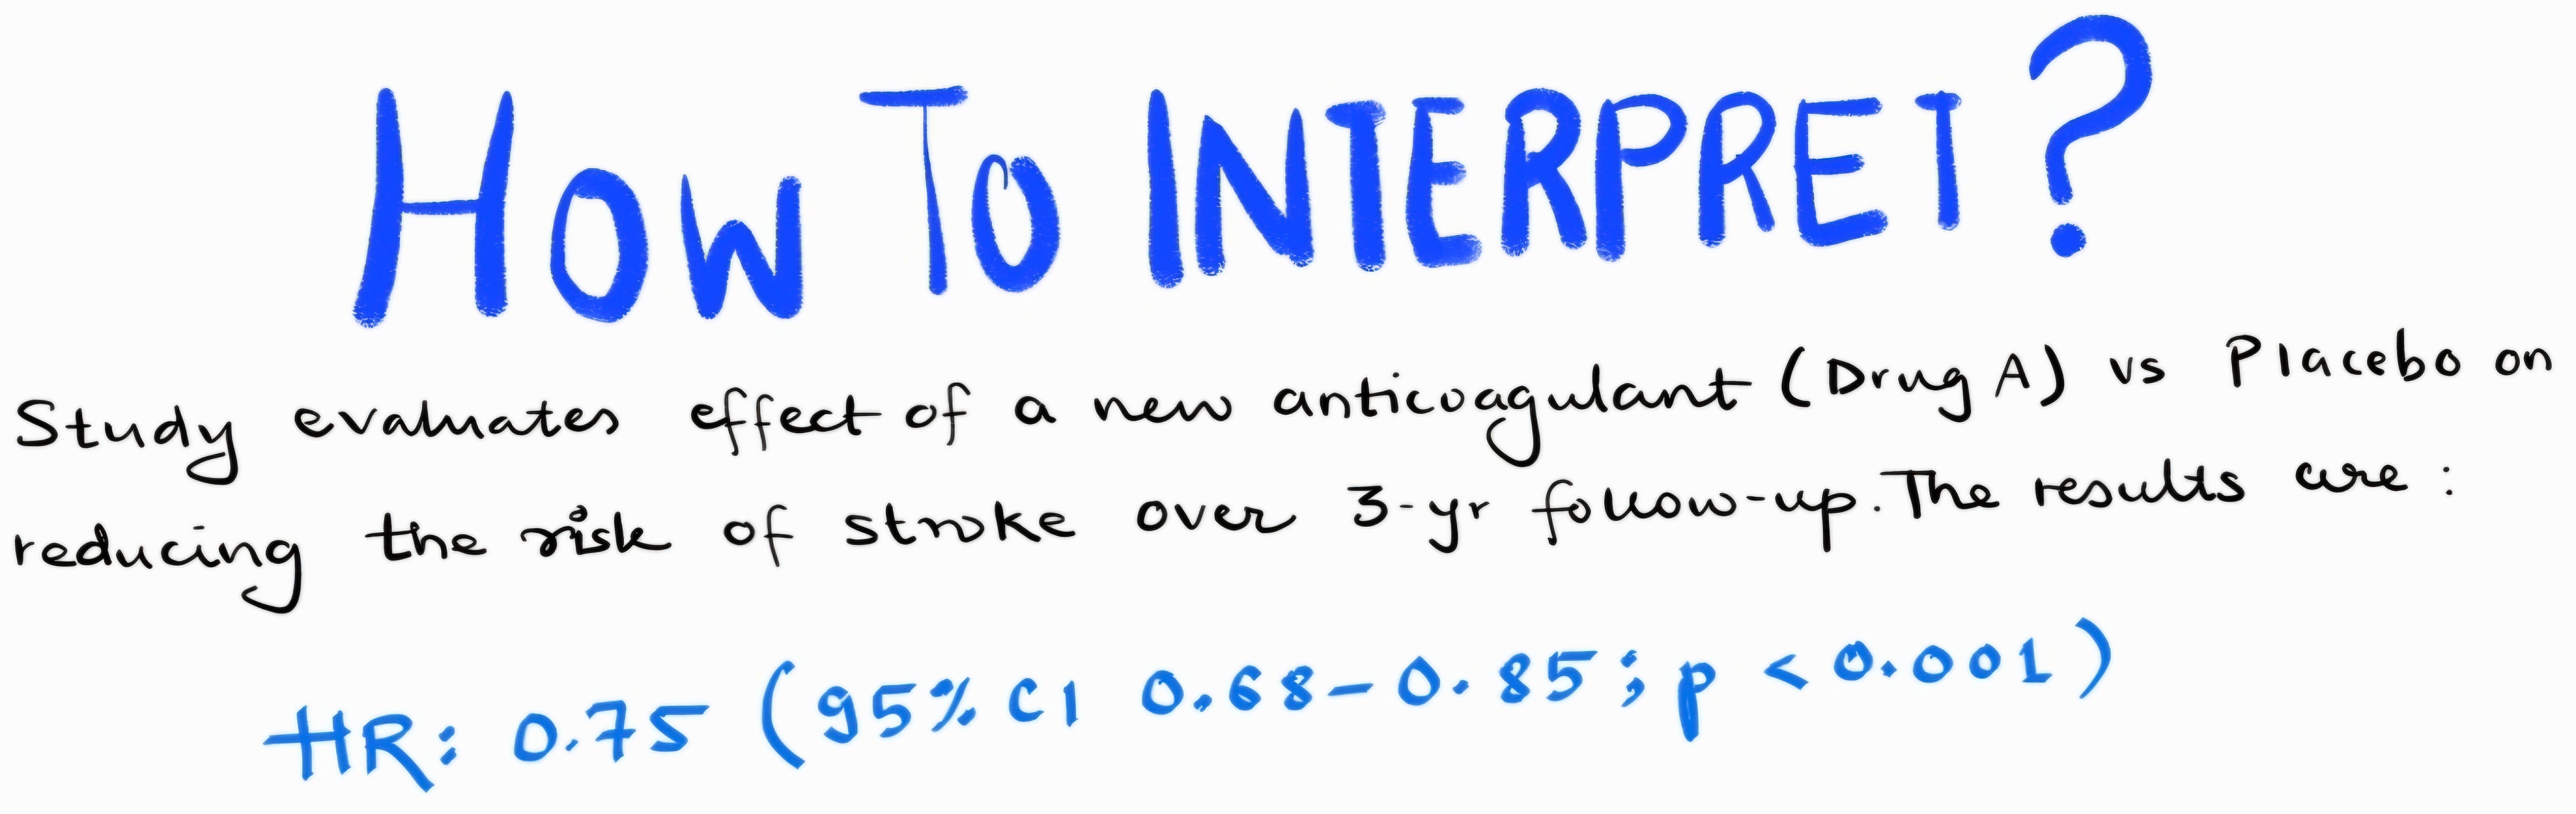
Clinical trial evaluating a new drug for stroke prevention:
P-Value = 0.02: Indicates a statistically significant difference exists.
But is it clinically meaningful? For that, you need HR and CI.
What is a Hazard Ratio (HR)?
Definition:
A hazard ratio compares how often an event (e.g., stroke) happens in the treatment group versus the control group over time.
Interpretation of HR:
HR = 1: No difference in risk between groups.
HR < 1: Reduced risk in the treatment group.
HR > 1: Increased risk in the treatment group.
Example:
Imagine two groups of kids racing on a playground:
Group 1 wears red shoes.
Group 2 wears blue shoes.
HR = 1: Both groups fall equally often → No difference.
HR = 2: Red shoes kids are twice as likely to fall → Increased risk.
HR = 0.5: Red shoes kids are half as likely to fall → Reduced risk.
What is a Confidence Interval (CI)?
Definition:
A CI is a range that estimates the true value of a measure (e.g., HR) with a specific level of confidence (usually 95%).
What exactly do confidence intervals mean?95% CI means that if we repeat a similar study for 100 times, the observed effect will lie within the specified range in 95 of the 100 times.
Key Points to Interpret CI:
CI Range does not include 1 : Significant → Strong evidence for effect.
CI Range Includes 1 : Not significant → Effect may not exist.
Narrow CI: High precision, results are reliable.
Wide CI: Low precision, results are less reliable.
Lets understand better with an example -
HR = 2 (95% CI: 1.5–2.5):
Red shoes kids are 2 times more likely to fall than blue shoe kids
CI excludes 1 → It means the above difference is statistically significant
Narrow CI → Results are precise and reliable.
HR = 0.8 (95% CI: 0.5–1.2):
1 - 0.8 = 0.2 ( 20 % effect )
It means red shoes kids have 20% less change of falling than blue shoe kids
But CI includes 1 → Not statistically significant.
What exactly does CI includes 1 mean?
When we are interpreting CI as per above definition, the actual meaning of CI is - ‘The range of actual effect lies in between 50 % risk reduction ( 1 - 0.5 = 50 % ) to 20 % increased risk ( 1 - 1.2 = -0.2 %).
By extension it means that Hazard ratio can also be equal to 1 . HR = 1 means there is no effect, no harm.
That means if CI involves 1 in the range, we consider the effect as not statistically significant.
Q4: What if HR is More than 1? How is it Significant?
HR > 1 Interpretation:
Indicates increased risk in the treatment group compared to the control group.
Checking Significance of HR > 1:
If CI excludes 1, it’s statistically significant.
If CI includes 1, it’s not statistically significant.
Example:
HR = 2.0 (95% CI: 1.5–2.5):
2-fold increased risk.
CI excludes 1 → Significant.
HR = 1.5 (95% CI: 0.9–2.1):
50% increased risk.
CI includes 1 → Not significant.
Q5: What is the Clinical Significance of HR Position in CI?
1. HR Close to the Center of CI:
Indicates high precision. Results are reliable and consistent.
Example: HR = 0.75 (95% CI: 0.70–0.80).
2. HR Near One End of CI:
Indicates lower precision and variability in results.
Example: HR = 0.95 (95% CI: 0.90–1.10).
3. HR Near 1 within CI:
Results lack clinical or statistical significance.
Example: HR = 1.05 (95% CI: 0.95–1.15).
Q6: Why Combine P-Value, HR, and CI?
P-Value Alone:
Shows statistical significance but not the magnitude or direction, nor clinical relevance.
HR and CI:
Provide the direction, magnitude, and reliability of the effect.
Clinical Trial Example: Stroke Risk Reduction
P-Value: p = 0.02 → Statistically significant.
HR with CI:
HR = 0.80 (95% CI: 0.70–0.90).
20% reduced stroke risk ( 1 - 0.8 = 0.2 = 20% )
CI excludes 1 → Significant.
CI is narrow → Precise and reliable results.
Takeaways:
P-Value: Shows there is a statistically significant effect.
HR and CI: Provide the magnitude (20% risk reduction), direction (reduced risk), and reliability (narrow CI).
Clinical Relevance: The treatment effectively reduces stroke risk.
Other measures of statistical significance
Absolute vs. Relative Risk
Absolute Risk Reduction (ARR): The actual difference in risk between groups.
Example: 20% risk in the control vs. 10% in the treatment = ARR of 10%.
Relative Risk Reduction (RRR): The proportion by which the treatment reduces risk.
Example: 10% ARR / 20% control risk = 50% RRR.
"Relative risks often look more impressive but don’t forget the absolute numbers!"
e. Number Needed to Treat (NNT)
Definition: Number of patients that need to be treated for one to benefit.
Example: "If NNT = 10, it means for every 10 patients treated, 1 will benefit."
Lower NNT = more effective treatment.
Common Pitfalls in Interpretation
Confusing statistical significance with clinical significance.
Ignoring the size of the effect (e.g, a tiny effect that’s statistically significant).
Over-reliance on p-values without looking at confidence intervals.
Misinterpreting non-significant results as "no effect" rather than "inconclusive."
Lets is hammer in with another example -
A Quick Case Study
Use a simple study to demonstrate the concepts:
Scenario: A trial comparing Drug A and Drug B for reducing stroke risk.
P-value = 0.02 (statistically significant).
HR = 0.8 (95% CI: 0.7–0.9) → Treatment reduces risk by 20%, and the true effect is between 10–30%.
ARR = 2% → Risk reduced from 10% to 8%.
NNT = 50 → Need to treat 50 patients to prevent 1 stroke.
While results are statistically significant, the clinical relevance depends on the context
Thank you.
Please email me at drarpmd@gmail.com if you have any further doubts.